In [31]:
from IPython.display import HTML

HTML('''<script>
code_show=true;
function code_toggle() {
 if (code_show){
 $('div.input').hide();
 } else {
 $('div.input').show();
 }
 code_show = !code_show
}
$( document ).ready(code_toggle);
</script>
<form action="javascript:code_toggle()"><input type="submit" value="Click here to toggle on/off the raw code."></form>''')
Out[31]:
In [33]:
import pandas as pd
import matplotlib
from IPython.display import Image
from IPython.core.display import HTML

%matplotlib inline
311 Data Exploration
In [34]:
df=pd.read_csv('311_geo_report.csv',parse_dates=['requested_datetime','updated_datetime','closed_date'])
df.shape
Out[34]:
Sample Data
In [35]:
df.head()
Out[35]:
Number of requests per year
In [36]:
df['count']=1
df['year']=df.requested_datetime.dt.year
df[['year','count']].groupby('year').count().plot(kind='bar')
Out[36]:

In [39]:
df=df[df['year']==2017]
df['month']=df.requested_datetime.dt.month
df[['month','count']].groupby('month').count().plot(kind='bar')
Out[39]:

In [40]:
df=df[df.month>2]
df.shape[0]
Out[40]:
Most frequent request types (top 10)
In [41]:
top_services=df.service_name.value_counts().head(10)
top_services.plot(kind='barh',figsize=(10,5))
Out[41]:

Total Number of frequent requests (top 10) from Feb to June (2017)
In [44]:
df=df[df.service_name.isin(top_services.keys())]
df.shape[0]
Out[44]:
Request types by month (March 2017 - July 2017)
In [45]:
dg=df[['service_name','month','count']].groupby(['month','service_name']).count().unstack()
dg.columns=dg.columns.droplevel()
dg=dg[list(top_services.keys())]
dg.plot(figsize=(10,7),kind='bar',stacked=True).legend(loc='center left', bbox_to_anchor=(1, 0.5))
Out[45]:

Request types by hours
In [46]:
df['hour']=df.requested_datetime.dt.hour
In [47]:
dg=df[['service_name','hour','count']].groupby(['hour','service_name']).count().unstack()
dg.columns=dg.columns.droplevel()
dg=dg[list(top_services.keys())]
dg.plot(figsize=(17,10),kind='bar',stacked=True)
Out[47]:

Calculating response times
In [51]:
df['response_time']=df.closed_date-df.requested_datetime
df['response_days']=df.response_time.dt.days
In [52]:
df=df[df.response_time.dt.seconds>0]
In [53]:
dg=df[['service_request_id','service_name','response_days']].pivot(index='service_request_id',columns='service_name')
dg.columns=dg.columns.droplevel(0)
Response times by types (in days)
In [54]:
l=list(dg.median().sort_values(ascending=False).index)
l=[s for s in l if s not in ['CS-Lost call (wrong #, hang up, dead air)',
                             'Ticket info. (balance, how many, citation #, etc.)',
                             'Welcome desk information',
                             'ISD-Buildings'
                          ]]
dg[l].boxplot(figsize=(15,5),vert=False,grid=False,showfliers=False,return_type='axes')
Out[54]:

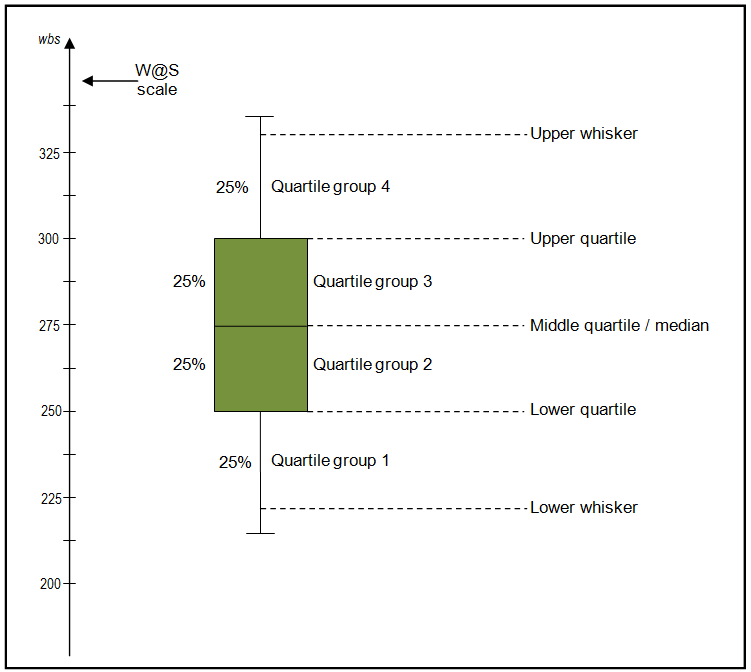
* boxplot guide
In [55]:
Image(url= "boxplot.png", width=400, height=400)
Out[55]: